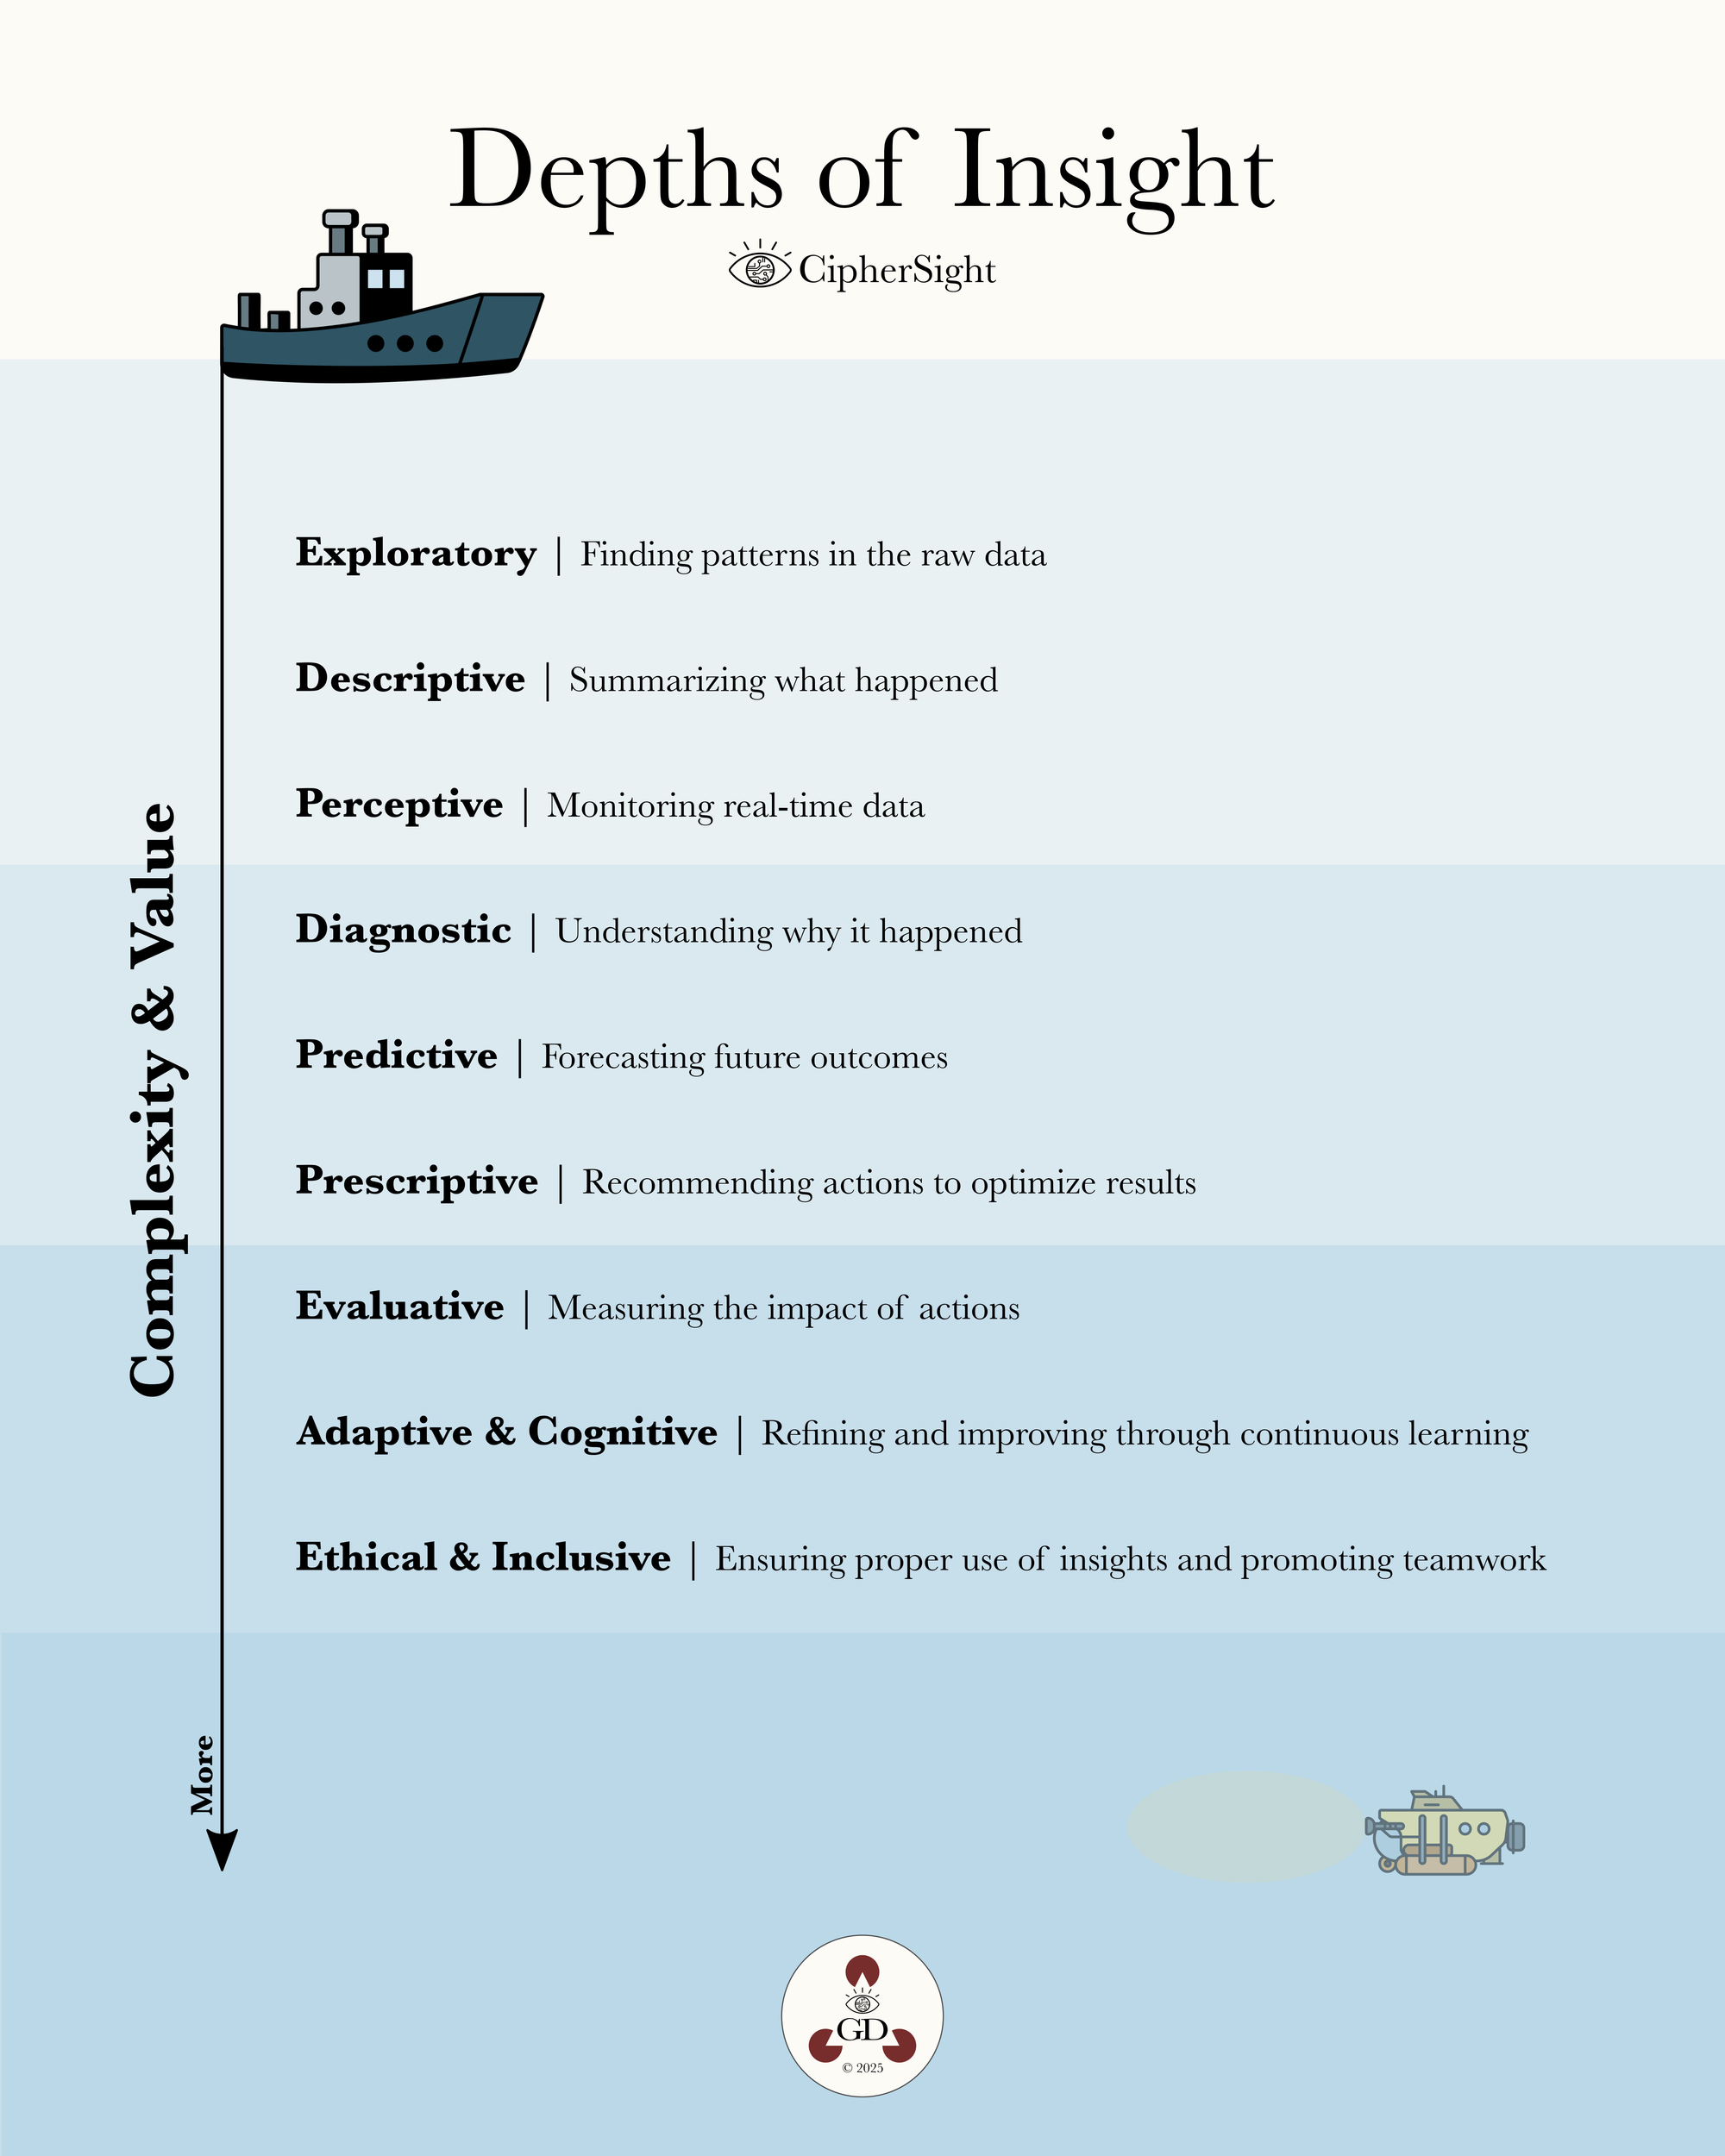
The Depths of Insight

While working on Part IV of my series Inflation, Supply & Demand, and Eggs, I found myself defining numerous analytics-related terms. This leads me to take another detour to introduce what I’m now calling The Depths of Insight. While this concept isn’t groundbreaking—there are plenty of visuals and infographics similar to this one—I felt it was important to include here. It serves to highlight that not all types of analytics are equal in terms of complexity and value. Each type builds on and compounds the insights provided by the others, creating a foundation for deeper analysis. Skipping over the foundational, "shallower" analytics in an attempt to dive straight into "deeper" analytics risks failure or, worse, generating flawed or misleading outcomes.
In this Inflation, Supply & Demand, and Eggs series, I'll be captaining our own Alvin (putting a pin in that as the branding for the previously mentioned Forecast Factory product) through the depths of insight where - going deep into what it means to be "Data-Driven" and de-mystifying the process as we go.
Without further ado, here is an overview of The Depths of Insight:

Exploratory
Finding patterns in the raw data: Up to this point, we've done a (in my opinion) a thorough job in our exploratory analysis, looking at the historical data to find patterns in the raw data. This has helped us build a generalized supply chain that will be our simplified mental model of how eggs go farm-to-table. Nevertheless, here is some reference material if you'd like to read further.
Descriptive
Summarizing what happened: This is what most people think of when they hear the term "statistics." They often associate it with measures like the mean, median, and mode. While this is true, descriptive statistics go far beyond these basics. They include tools for summarizing data more comprehensively, such as variance and standard deviation, and can be applied to univariate analysis (e.g., analyzing the price of eggs) as well as bivariate and multivariate analysis (e.g., correlation analysis, scatterplots, and cross-tabs examining the relationship between the price of eggs and the price of corn).
Although descriptive statistics are considered relatively "shallow" in the overall Depths of Insight, they can still provide tremendous value. At this stage, the primary goal is to clearly and compellingly summarize what has happened in the past. This foundational understanding is essential for building deeper analyses and driving those meaningful, "deeper" insights that can help individuals and organizations navigate, and ultimately shape, the future's inherently volatile nature.
Perceptive
Monitoring Real-Time Data: Focusing on real-time monitoring and detection of unusual patterns or behaviors in data. Often falling into the realm of anomaly detection, this type of analytics uses thresholds—defined by descriptive statistics such as means, standard deviations, or percentiles—to identify when new observations deviate significantly from what’s expected. Alerts can be configured to notify decision-makers when data points fall outside these thresholds, enabling rapid responses to potential issues. For example, if the price of eggs suddenly spikes beyond a statistically defined range, perceptive analytics could trigger an alert to investigate potential causes, such as supply disruptions or market anomalies. By bridging descriptive insights with real-time action, perceptive analytics ensures that organizations remain agile and proactive.
In due course, I’ll share the API call strategy I’ve been using to pull data directly from FRED—eliminating the need to download files into Excel and manually manipulate them. I’ll also demonstrate how anomaly detection works in practice. This will likely come toward the end of the series, once we have more real data available beyond the current November cut-off. This approach will ensure a more robust and impactful final case study.
Diagnostic
Understanding why it happened: focusing on understanding why something happened by uncovering the root causes behind observed trends or anomalies. While there is some overlap with descriptive analytics—which aims to summarize past events—diagnostic analytics takes this a step further by really putting the relationships and drivers behind the data under the microscope. This often involves expanding upon descriptive techniques, such as correlation analysis or linear and multivariate regression, to uncover deeper insights. As the analysis progresses, it can eventually lead into the realm of Causal Inference, where the goal is to establish and quantify direct cause-and-effect relationships. To illustrate the difference, examine the following two statements:
- Descriptive / Diagnostic Analytics: By analyzing the patterns and trends using techniques such as correlation, regression, and decomposition, I determined that the rise in egg prices was driven significantly by an increase in corn prices, a key input for chicken feed.
- Causal Inference: Using randomized experiments, propensity score matching (though prohibitively expensive for this analysis), or statistical techniques like instrumental variable analysis, I determined that a 10% increase in corn prices leads to a 5% increase in egg prices, holding all else constant.
Predictive
Forecasting future outcomes: Up to this point, we’ve used analytics to identify what’s happened in the past, describe and measure the magnitude of those events, and even form some more-or-less valid hypotheses about why things happened the way they did. The next logical step is to use this information to make educated guesses about what might happen in the future—this is the realm of predictive analytics.
There’s no shortage of resources available to help you become a better predictive analytics practitioner, but at its core, predictive techniques can be categorized into two types: classification (e.g., determining whether something is an egg) and quantification (e.g., figuring out how many eggs there are). Time series analysis—which we will be engaging in—broadly falls into the latter category but comes with a unique challenge: autocorrelation.
Autocorrelation is essentially the question, “How much does knowing today’s price of eggs help in predicting tomorrow’s price?” Absent a major supply shock, it’s reasonable to assume that prices will be similar from one day to the next. When we get to the predictive portion of this case study, we’ll explore this concept in greater detail, examine how it shapes forecasts, and ensure it's properly controlled for.
Prescriptive
Recommending actions to optimize results: Having a solid understanding of what has happened and a clear prediction of what might happen next puts you in a strong position to make truly data-driven decisions. While there are plenty of resources available on mastering prescriptive analytics, our case study will approach it through the three disciplines I've had exposure to and can speak to: Stochastic Programming, Linear Programming, and Game Theory.
Each one of these are meaty topics in their own right that I'll save for other posts.
Evaluative
Measuring the impact of actions: Focusing on measuring the impact of actions or decisions to determine their effectiveness. This type of analytics is critical for refining strategies, improving outcomes, and ensuring resources are allocated efficiently. Recently, evaluative analytics has undergone a rebranding of sorts, becoming popularly known as "A/B Testing."
A/B testing involves comparing two versions of something—like headlines, product designs, or marketing strategies—and analyzing which one performs better based on a predefined metric (e.g., engagement, conversions). For example, you might test two headlines to see which garners more clicks, allowing you to make data-driven decisions about your messaging.
However, when A/B testing or other evaluative analytics methods extend beyond determining superficial choices—like the shade of blue for a button—to evaluating potential strategic alternatives, they become critical tools for refining strategies, improving outcomes, and ensuring resources are allocated effectively.
Adaptive & Cognitive
Refining and improving through continuous learning: This represents the pinnacle of data-driven decision-making by enabling algorithms to continuously learn, adapt, and improve all of the insights mined and accumulated over time. Unlike traditional analytics, which often operate on static models or predefined rules, adaptive and cognitive systems evolve with new data, refining their predictions and recommendations to align with changing conditions.
The ultimate goal of adaptive and cognitive analytics is to create a cycle of continuous improvement, where each decision informs the next, making the system smarter and more effective over time. By combining the ability to predict outcomes with the power to adapt and refine, these analytics drive innovation and resilience in a rapidly changing world.
Ethical & Inclusive
Ensuring proper use of insights and promoting teamwork: It’s essential to ensure that this entire process is carried out inclusively and ethically. Inclusion fosters diverse perspectives, aligning data-driven insights with the expertise and intuition of stakeholders across teams. This not only improves decision-making but also ensures that analytics solutions address real-world challenges effectively.
Equally important is the ethical application of these powerful tools. Algorithms must be transparent, fair, and free from bias, with safeguards to protect privacy and prevent unintended consequences. By prioritizing inclusion and ethics, we can build systems that are not only intelligent and adaptive but also aligned with organizational values and societal good—ensuring a sustainable and trustworthy foundation for the future of analytics.
These topics may not be the most challenging to implement technically, but they represent some of the most complex challenges we face as a society coping with the rapid pace of change in this space. It should also be noted that, up to this point, I've been referring to the value of a particular type of analytics from the company's perspective. Here, I am describing value to society—these are not always perfectly aligned, and we should always aim to do what’s best for the greater good.


