In Defense of Shiny Things

Another tangent, though this one more directly related to Part IV. At this point in our journey, I want to take a moment to talk about the tools of the trade—introducing what I have been/will be using going forward: R, RStudio, Posit, and Shiny.
To start, it’s worth observing that over the course of the past few years, "Analytics" and "Dashboards" have become almost synonymous.
Alongside this, there seems to have been a paradigm shift where tools have taken precedence over processes in the analytics space. Today, there’s no shortage of off-the-shelf tools for building data pipelines and conducting data mining—such as Informatica, Alteryx, dbt, Knime, Orange, and SAS Enterprise Miner—or tools for data visualization, including Tableau, Power BI, Looker, MicroStrategy, and Think Cell. Of course, we can’t forget the trusty and dependable Microsoft Excel, a cornerstone of analytics for decades.
This post isn’t to argue that these tools don’t have a place—they absolutely do. However, most of these platforms are designed for large enterprise clients and are marketed as "Low-Code/No-Code" analytics tools, emphasizing ease of use and a gentler learning curve compared to doing analysis with R or Python. With both R and Python being two of the most popular programming languages in the analytics and data science world, I'll take a moment to compare and contrast:
Python: The Generalist
Python is a general-purpose programming language, widely used across various domains, including web development, machine learning, automation, and, of course, data analytics. Its versatility makes it an excellent choice for building end-to-end data solutions, from extracting and cleaning data to creating advanced machine learning models. Python has a rich ecosystem of libraries that include:
- Pandas: Data manipulation
- NumPy: Numerical computing
- Matplotlib/Seaborn: Data visualization
- Scikit-learn: Machine learning
Python is a powerhouse for analytics workflows. Its user-friendly syntax and expansive community support make it a go-to language for data professionals and general developers alike.
R: The Statistician's Language
R, in contrast, was built specifically for statisticians and data analysis, making it a more specialized tool for analytics. It excels at statistical modeling, data visualization, and exploratory data analysis. R’s built-in functionality for tasks like hypothesis testing, linear regression, and advanced statistical techniques is unparalleled, and its libraries. Some examples here are:
- ggplot2: Data visualization
- dplyr: Data manipulation
- caret: Machine learning
- forecast: Time series analysis
- fredr: Connecting to the FRED backend with API wrappers
- data.table: Optimized computing for large datasets
R’s strength lies in its ability to quickly perform complex statistical analyses with minimal setup, making it particularly favored in academic and research settings. Its steep learning curve is often offset by its laser focus on statistical rigor and powerful visualization capabilities.
Which to Choose?
Choosing between R and Python often depends on your project’s goals: Python for versatility and integration, R for statistical depth and precision. Both are invaluable tools for analytics professionals, with many opting to use them together in their workflows. Choosing to skip over them all together and going with a "Low-Code/No-Code" solution also makes sense in a lot of instances. So in answering "which tool or setup should I go with?" I'll give the same answer that applies to so many questions in life: "It depends."
It depends on the size of your team, the experience of your analysts, the budget you're willing to spend, and perhaps most importantly, it depends on getting the right buy in from the key stakeholders.
Current Set-up
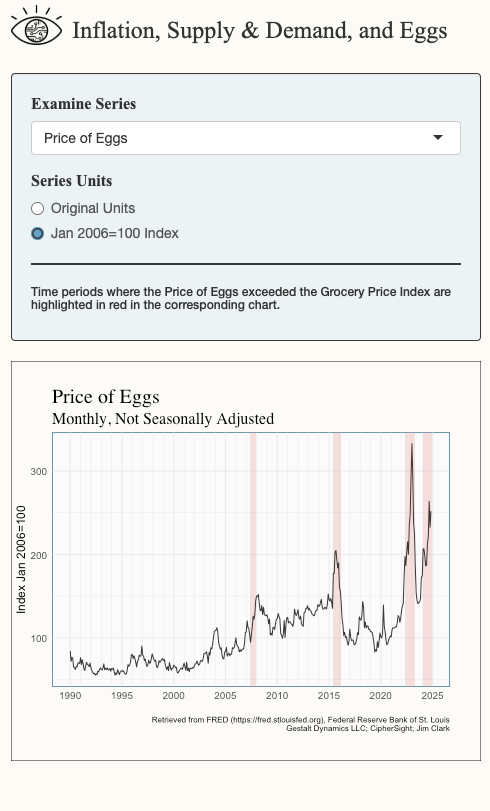
So with all that background, I'll disclose that I'm currently entirely in the Posit ecosystem; I'm developing my analysis using R in the RStudio IDE, and now for the first time, publishing a Shiny web application through the shinyapps.io service! See below and experiment with the user experience below:
Shiny
I’ve always had a love/hate relationship with Shiny. On one hand, its level of customization is incredible—being a web-based application, you can use HTML, Javascript & CSS to fine-tune every visual element of the user interface, while the R-powered backend brings static analyses to life, making them dynamic and interactive. On the other hand, it comes with a steep learning curve, and its flexibility can sometimes be a double-edged sword, making it a bit of a pain to work with.
That said, one of the core principles in the Gestalt Dynamics mission and vision is the belief in “leaning into complexity” to uncover value. With that in mind, I’m moving forward with developing a more comprehensive and interactive Shiny app for the Inflation, Supply & Demand, and Eggs series. It’s a challenge, but one that I’m excited to tackle, knowing the potential impact it can have.
Motivations and Plans for Alvin
In my previous post The Depths of Insight, I referred to plans for a product I'm now calling Alvin. I want to take a moment to explain how this ties into this newsletter, the Inflation, Supply & Demand, and Eggs series (Part I, Part II, Part III), and clarify my overall motivation for putting in this work:
- My motivation for writing this newsletter is to synthesize as much of what I've learned and practiced over the past decade as possible and share it with as many people as possible. With that said, I want to emphasize that I am also learning new things as I'm going along and do not want to give the impression that any of this is out of reach or takes years of experience to understand, it mainly takes curiosity and follow-through.
- The Inflation, Supply & Demand, and Eggs series is to me, similar to a mid-career capstone project or dissertation as a practioner of data analytics. It has been immensely rewarding to me to re-visit the fundamentals, and I am genuinely excited to see how far I can take it. I chose to look at the price of eggs since it was such a big topic in the debates leading up to the U.S. Presidential elections of 2024, but generally speaking, the concepts and principles discussed in the series can be applied across industries and products. Which leads us to:
- Alvin: The end goal though is to create a generalized, systematic, web-based analytics app (Alvin) that CipherSight members will be able to use to easily apply the lessons learned in the Inflation, Supply & Demand, and Eggs series to their own datasets.
Development Roadmap:

Conclusion
In the ever-evolving world of analytics, it’s easy to get swept up in the discussions around tools, platforms, and analytics solutions. Ultimately though, the right choice depends on multiple factors—team size, budget, stakeholder buy-in, and the nature of the insights you aim to uncover.
As I continue exploring the depths of R, Shiny, and the broader Posit ecosystem, my goal remains clear: to synthesize years of learning into actionable content and, through Alvin, give anyone the power to explore these concepts hands-on. Whether you’re here out of curiosity or in pursuit of deeper data expertise, I hope these explorations spark fresh perspectives and encourage you to lean into complexity to unearth new value. Thank you for joining me on this journey—there’s much more to come!
Also, in case it's not rendering correctly where you're reading this, this is what the output should look like depending on whether you're accessing on the computer or the phone:


